An introduction to Performance Monitor – part 1
In my last SQL Server 2012 administration seminar, I used Performance Monitor to analyse and troubleshoot issues regarding SQL Server.
It is built into Windows and many administrators used it a lot in the old days when some of the tools we have now in our disposal did not exist.
So this is a free tool that you do not need to download.
Performance Monitor or PerfMon for short, can be used to monitor performance real-time, capture various metrics and you can select what you want to monitor and for how long.You can capture information about the hardware, the operating system, SQL Server and more.So it is not a tool for troubleshooting SQL Server only. The whole process is automated and so is the data collection.
With PerfMon we can track nearly every type of system performance
The overhead of using PerfMon is minimal in most cases but you should be careful when selecting the sampling interval.
One good advice is not to use too many counters and not sampling intervals less than one second.
Sometimes it is better to use DMVs,Trace, SQL Server profiler and Extended Events.
You should use PerfMon when you need to collect OS and hardware resource counters as well as SQL Server counters.
The performance data generated by a system component is represented by a performance object
A performance object provides counters that represent specific aspects of a component such as % Processor Time for a Processor object
PerfMon allows real-time data to be viewed and analysed in multiple ways.
In this post I am going to present some of the main SQL Server counters that can be monitored through Performance Monitor and some none SQL Server related counters.
You do not require to have any previous knowledge.
You can start PerfMon by going to Start->Run->perfmon or you can go Control Panel\All Control Panel Items\Administrative Tools and then start Performance Monitor.
When I start PerfMon I see the Processor counter counter. I will add some more.
Have a look at the picture below

I click on the green cross icon, and I add some counters for the PhysicalDdisk object.
I will add the Avg. Disk Sec/Read counter and the Avg. Disk Sec/Write, select them and add them to the counters area.
Have a look at the picture below

Avg. Disk Sec/Read = average time in ms to read from disk
a good value for this counter is average value < 10 ms
Avg. Disk Sec/Write = average time in ms to write to disk
a good value for this counter is average value < 10 ms
Now I am going to add some more counters from the Memory object.
I will add Available bytes (free physical memory).
I will also add an SQL Server related counter (Batch Requests per second) from the SQL Server:SQL Statistics.
Then I install/attach the AdventureWorks2012 database. You can use any database you want.
I need to generate some workload so I can get values for the counters.
I use the free tool , SQL Load Generator, from codeplex to generate multiple reads and writes.
Once more I observe the counters and see/analyse the results.
I will show you some common options in the PerfMon GUI.
You can change the colour of the counter.
Have a look at the picture below

You can also change the view that you see the results. You can select e.g the Report view.
Have a look at the picture below

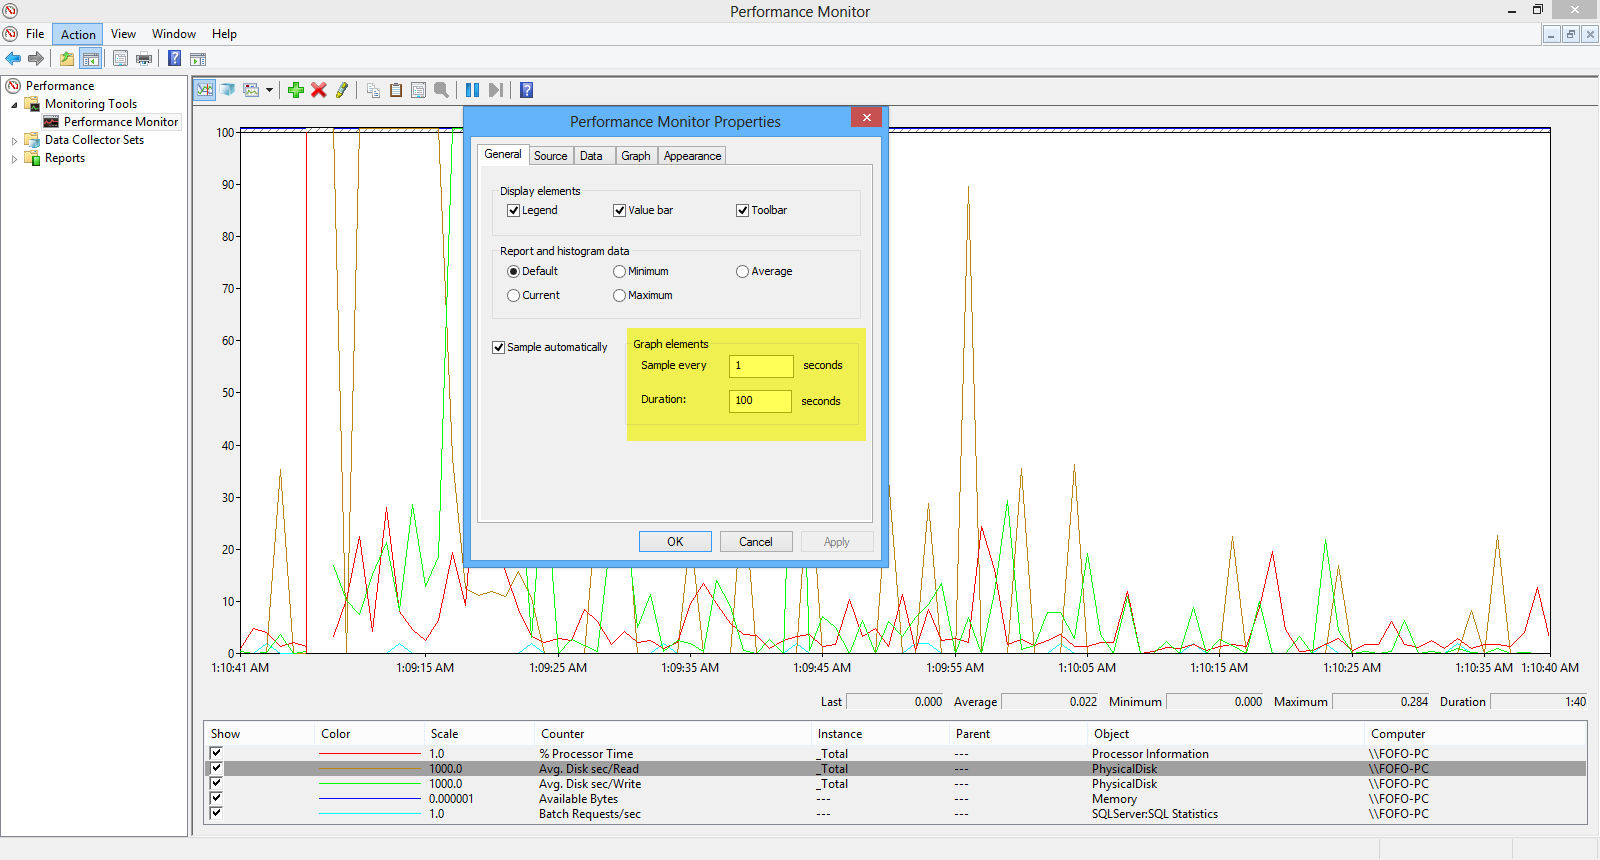
You can also change the Sample interval (1 second) and the Duration (default 100 sec)/
Have a look at the picture below

You can also add a counter, highlight a counter and freeze the display.

There will be more posts on Performance monitor.
Hope it helps!!!