Debugging ... With a fishbone!
Sounds familiar? The customer reports a problem that can't be reproduced. No errors were logged and no error messages generated. No-one can go to the customer's site for at least a day. All we have to work with are the symptoms reported by the customer and the source code. How do we find the bug with so little information ?
Sounds a bit like a detective novel, right? Like an episode from "Without a trace", the missing persons investigation series, maybe? Well, if it sounds like a detective mystery and feels like a detective mystery, why not handle troubleshooting like a detective mystery as well?
Indeed, there are significant similarities between troubleshooting and searching for a missing person. There is scant forensic evidence (no error logs or messages) and unreliable witness accounts (the customers' reports). Sometimes, the absence of a fact is a fact in itself (no error logs means the error logging code wasn't called). But it is not proof (the absence of error messages is not proof of the absence of errors).
We also have a powerful tool that the detectives lack. We have the source code, which allows us to re-enact the crime (oops, I mean the program’s execution) to check our hypothesis. But what happens when the code is unfamiliar or convoluted, and we can’t reproduce the effects described by the customers? We can read the code and identify the spots where something should or shouldn’t happen, but things can get very confusing, very fast. OK, why not copy one of the tools of the detectives of “Without a Trace”?
Many of you may have noticed the fishbone-diagram the detectives draw with each event from the moment a person goes missing, drawing a diagonal line for each significant event and action of the victim and the witnesses. This is a variation of the Cause and Effect or Ishikawa diagram, which is also called, guess what? The fishbone diagram! In the fishbone diagram, we write the facts in the “head”. From it, we draw a horizontal line. From this horizontal line we start drawing diagonal lines for each of the major probable “causes” that may lead to the described effects. For better legibility, we alternate the diagonal lines above and below the main horizontal line. That leads to the characteristic fishbone shape. We can keep analyzing the causes, alternating horizontal and diagonal lines, as seen on the figure below.
At some point we may uncover a cause that we can verify that it has happened. In this case, we erase the cause and add it as a fact to the head. Perhaps, we discover that executing a specific branch of the code results in some information log entries, and the customer verifies that the entries do exist. Great! We have just discovered a new fact! Or we may discover that all error handling code generates error messages. That, in conjunction with the fact that no error messages have been generated, means that the error handling code was never called. So, perhaps we have an On Error Resume Next? A Failure return value is ignored?
So, how can we use the fishbone diagram to troubleshoot an elusive problem? First, we add the “facts” we know to the head of the fishbone. In our case, these are that no export files appeared, there were no error logs and no error messages. Then, we add the major cause categories. These should include user error (the user was looking at the wrong folder), environment causes (database server down?) as well as the methods that are executed when the problem occurs (the Export method). The fishbone diagram below shows quite a few cases in red that could result in no exported files and no error messages. What if the dataset we read from the database is empty? What if we fail to handle row processing errors? What if we use On Error Resume Next in VB code, and fail to check the error codes?
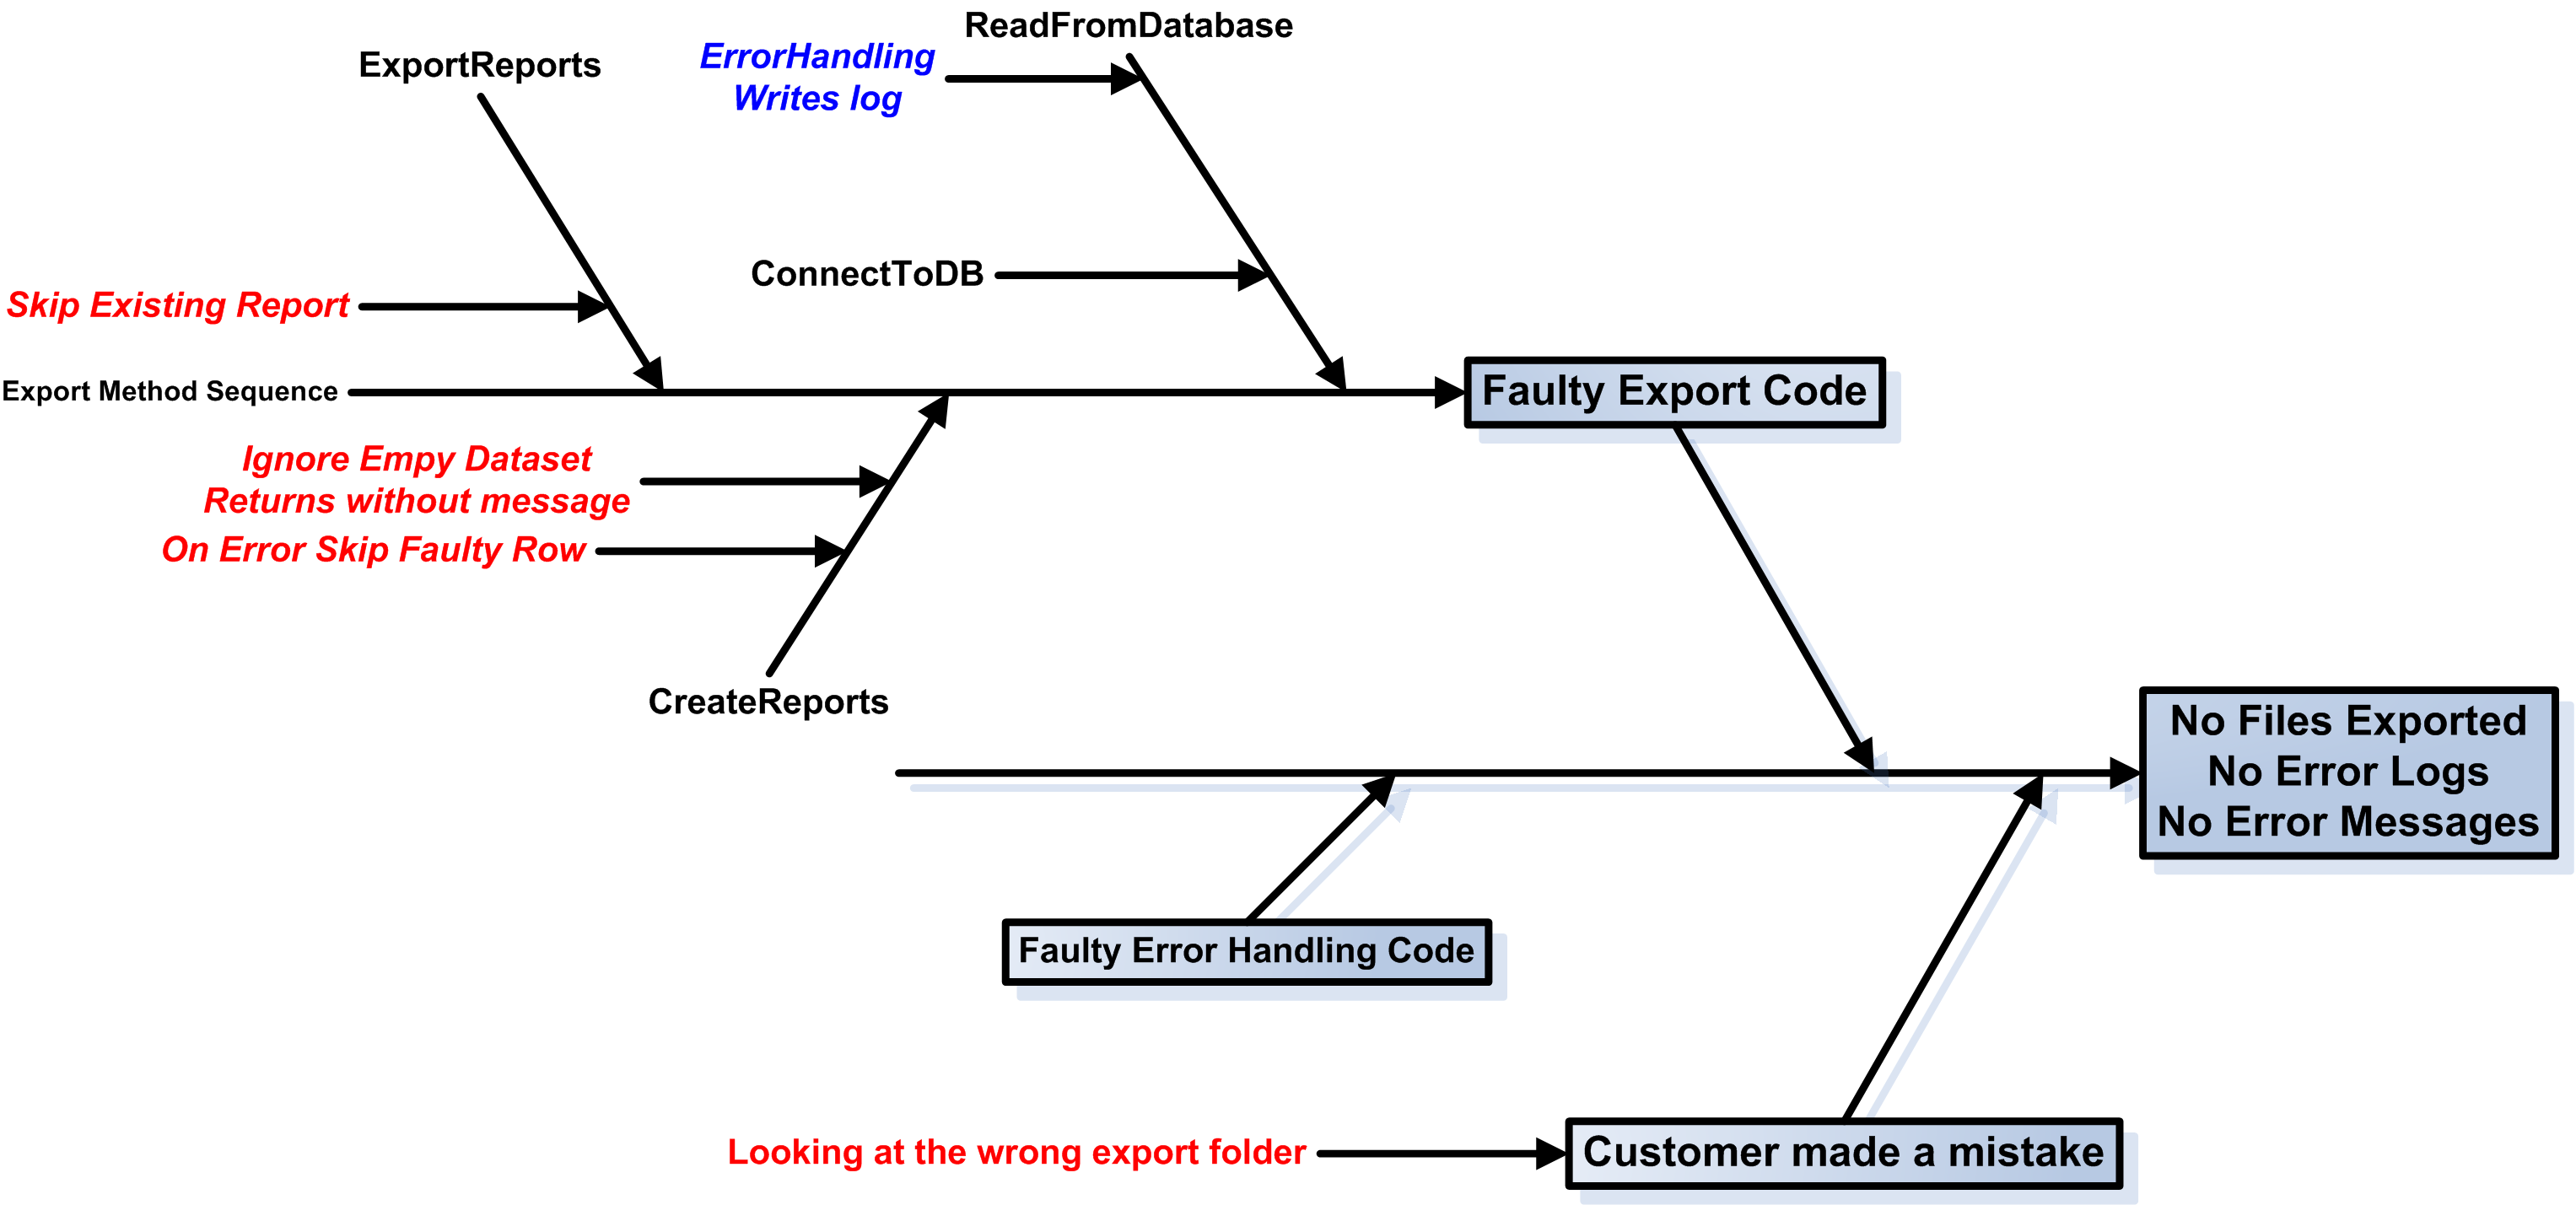
For the record, the customer had indeed made a mistake and looked in the wrong export folder. Checking the code using the fishbone diagram, though, helped identify several possible failure points in the code that could cause the same or similar problems in the future.